The recent media frenzy over the safety trial of an experimental coronavirus vaccine conducted by the University of Oxford was at best, premature. In India, misinformation has now become the accepted norm for the national media. It came as no surprise, therefore, that certain segments of the electronic and print media latched onto the news and raised everybody’s hopes; fiercely advocating that a vaccine was indeed possible within the short span of a year. As a science enthusiast, the claim raised innumerable questions in my mind: was this, as is being claimed, even realistically feasible? After consulting diverse journals and reports on progressions, it appears that the probability of having a vaccine within the short span of a year is negligibly slim.
Challenges to Accelerating Vaccine Development
The UK trial for the experimental vaccine will consist of 1100 patients as the sample base. Half of the sample size will be injected with the trial vaccine, while the other half will be administered meningitis vaccine as a control. The team behind the project hopes to gauge the effectiveness of the tests as early as August. However, most experts disagree with their schedule, calling it “unrealistic” at best. Maria Botazzi, a vaccine design expert at the Baylor College of Medicine, Houston, points out that the researchers will still need more time to determine how well the vaccine safeguards people from COVID-19, and if it results in unwarranted side effects when the vaccinated is subsequently exposed to the virus.
A 2013 study (Esther S. Pronker et al.) calculated that, before entering clinical trials, the average experimental vaccine has a 6 per cent chance of ultimately reaching the market. Of those that make it into trials, a 2019 analysis suggests the probability of success is 33.4 per cent. Even if the Oxford vaccine makes it past the arduous obstacles in its path, the real bottleneck lies in ramping up the mass manufacturing ability- effective vaccination drives will require hundreds of millions of vials to be produced and distributed worldwide. The study also found that between 1998 and 2009, the average time to develop a vaccine was 10.7 years. Even the fastest vaccine to be developed, that of the Ebola, took five years from its conceptualisation to mass adoption. To scale that period down to eighteen months or less would necessitate advancement onto next stages of development before the earlier stages can be completed. It is clear, therefore, that no government can base its exit strategy upon misplaced hopes of early vaccine development.
Novel techniques to detect COVID-19 impact
There has been an unusual flurry of papers that have been published on the nCoV-2019, ever since it gained public attention. A few of those stand out from the rest.
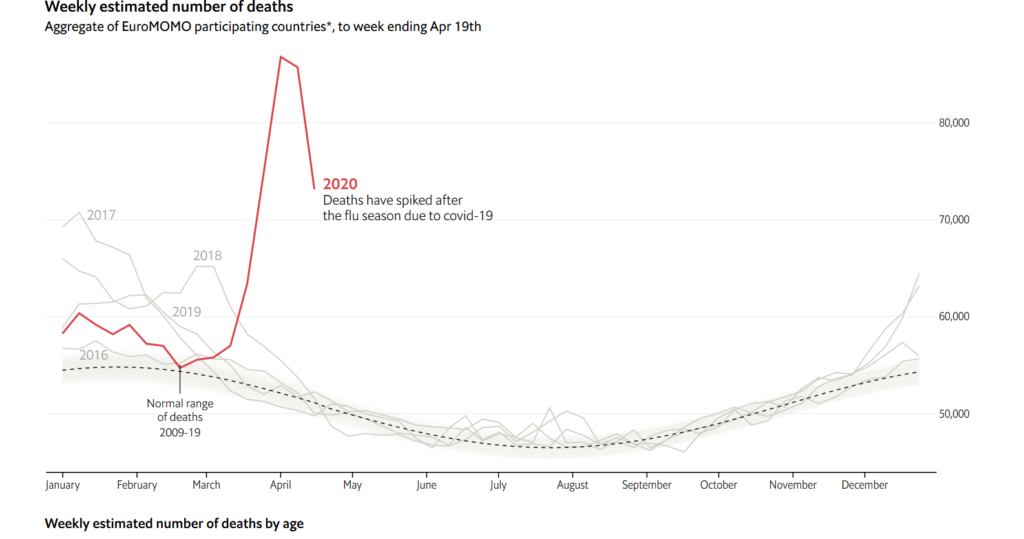
- Measuring Excess Deaths to gauge a realistic measure of COVID-19: At present, coronavirus deaths are underestimated grossly. This is obvious for a slew of reasons: deaths reported are only from those cases which have been clinically diagnosed or were subject to treatment for COVID-19. Therefore, to fill the void, the concept of “excess-deaths” can be applied to verify and get a true count of COVID-19’s impact at a regional level.
Excess deaths are nothing but the number of deaths which exceed the seasonal average for that region over a period of time. Studies by several groups have shown a noticeable bulge in deaths; the difference can be subtracted from the reported COVID-19 cases to know the gap we have left uncovered in our fight against the pandemic. Normally, at this time of the year, 50,000 people die each week in 24 European countries that report their death counts to the EuroMOMO monitoring scheme. This has shot up to around 90,000 and is still growing- the noticeable deviation can be attributed to the onset of the coronavirus.
Deviation from officially reported figures is appreciably large. At the peak of the crisis, one study estimates that the coronavirus was responsible for 52,000 deaths in Italy by April 18, twice the reported count. Similarly, an article in the Financial Times estimated that the actual number of COVID-19 related deaths in the UK was around 45,000, way more than the official tally of 17,000 (as of 21 April).
This measure can also be imported in India to effectively aid our efforts against the pandemic. In a nation where most are deprived of quality healthcare, it is obvious that not everybody with the virus would be diagnosed, and consequential deaths may even go unnoticed from the government’s radar. Basing action and policymaking on the true count will go a long way in making a heady recovery.
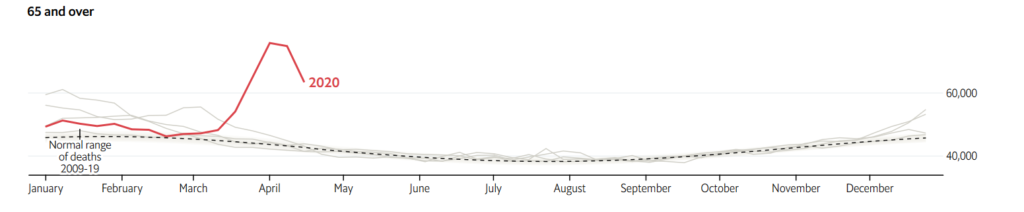
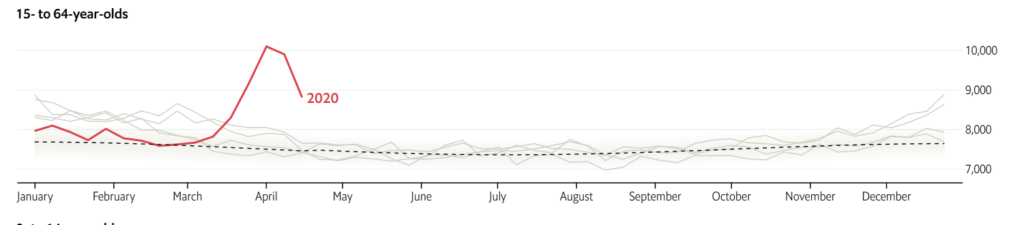
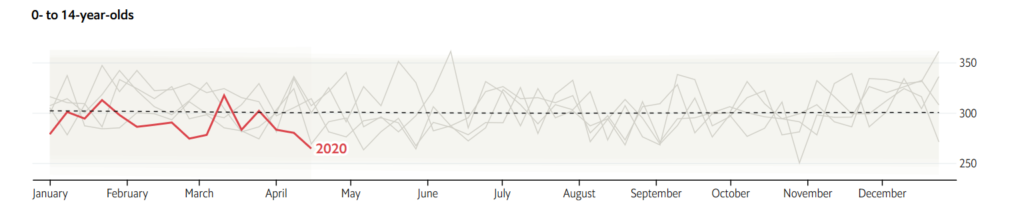
- Age-Wise Excess-Death figures, EuroMOMO:
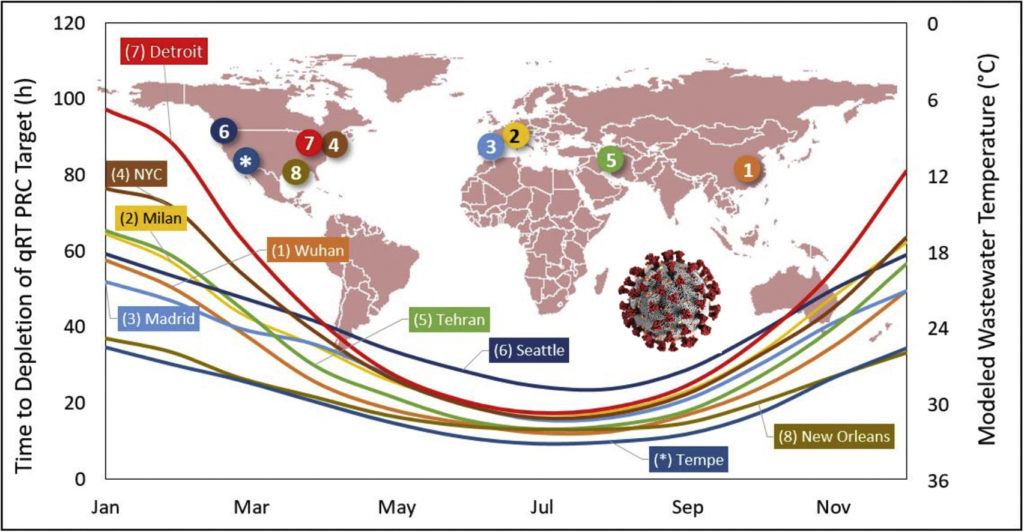
- Monitoring sewage water to track the spread of coronavirus: We can start monitoring about 2 billion people for possible coronavirus infection simply by looking at wastewater, a study by Hart and Halden suggests.
Such monitoring would come at a fraction of the present cost and can be done essentially with the same method that is currently employed to diagnose COVID-19 victims. Depending on local factors, including the temperature of the wastewater as well as the size of the sewerage system, the researchers claim that it would be possible to detect the infection even if one person out of 114 people using the sewerage line stands infected. In perfectly ideal conditions, where the wastewater is cool enough to preserve the viral RNA, the detection rate improves to 1 in 2 million people– an astounding figure at a minimal cost!
Although such testing will not lead to knowing which individual has the virus, it can be very effective to cordon off areas for further sanitisation and containment. In India, concerns are being raised about low testing rates per million of the population. Employing a cheap, yet efficacious method as this would help save crores of governmental money, all of which can be put into better use and development of medical institutions.
Their study can be graphically summarised by the following charts.

Greetings, dear reader. As you may have noticed, there are no advertisements on this blog. This is because I understand that knowledge must not be held captive to commercial interests. Yet, the costs of sustaining the website are huge. Your little contribution can go a long way to keep my independent, unopinionated fact-finding ventures and policy takes alive. There is no compulsion to contribute, but I would be over the moon if you could. Thank you for your time 🙂